The objective of this project is to analyze, organize, and interpret a compelling narrative from a sizable dataset—an exercise that characterizes the design process itself. The dataset was built by and for the classmates and peers at MassArt. Three weeks were spent exploring different strategies for conveying information: bird’s-eye-view, sequential, and interactive approaches that offer their own strengths and challenges. By the fourth week one final project was created, taking concepts from previous weeks in order to show the data in a creative way.


FINAL INTERACTIVE ARTWORK
The final piece created is a take on the sequential form of conveying data through stop-motion animation and bringing an interactive element to it. With the help of Artivive, the ability trigger animations by scanning objects (in this case the paint splotches) gives the viewer a feeling of interaction that would otherwise be impossible in a physical setting.


BUILDING THE DATABASE
Through collaboration questions were developed and narrowed down to the 21 most interesting. These questions were then asked and recorded to MassArt students resulting in over 400 points of data. After cleaning the data and deciding which set to move forward with, a group of 95 Communication Design student's responses were what fueled the handful of projects ahead.
BIRDS-EYE VIEW POSTER
Using 100 rows and 7 columns of data the goal was to design a poster showing an birds-eye perspective of a filtered down version of the database. The challenge was finding a story within the data to tell.


SEQUENTIAL VISUALIZATION
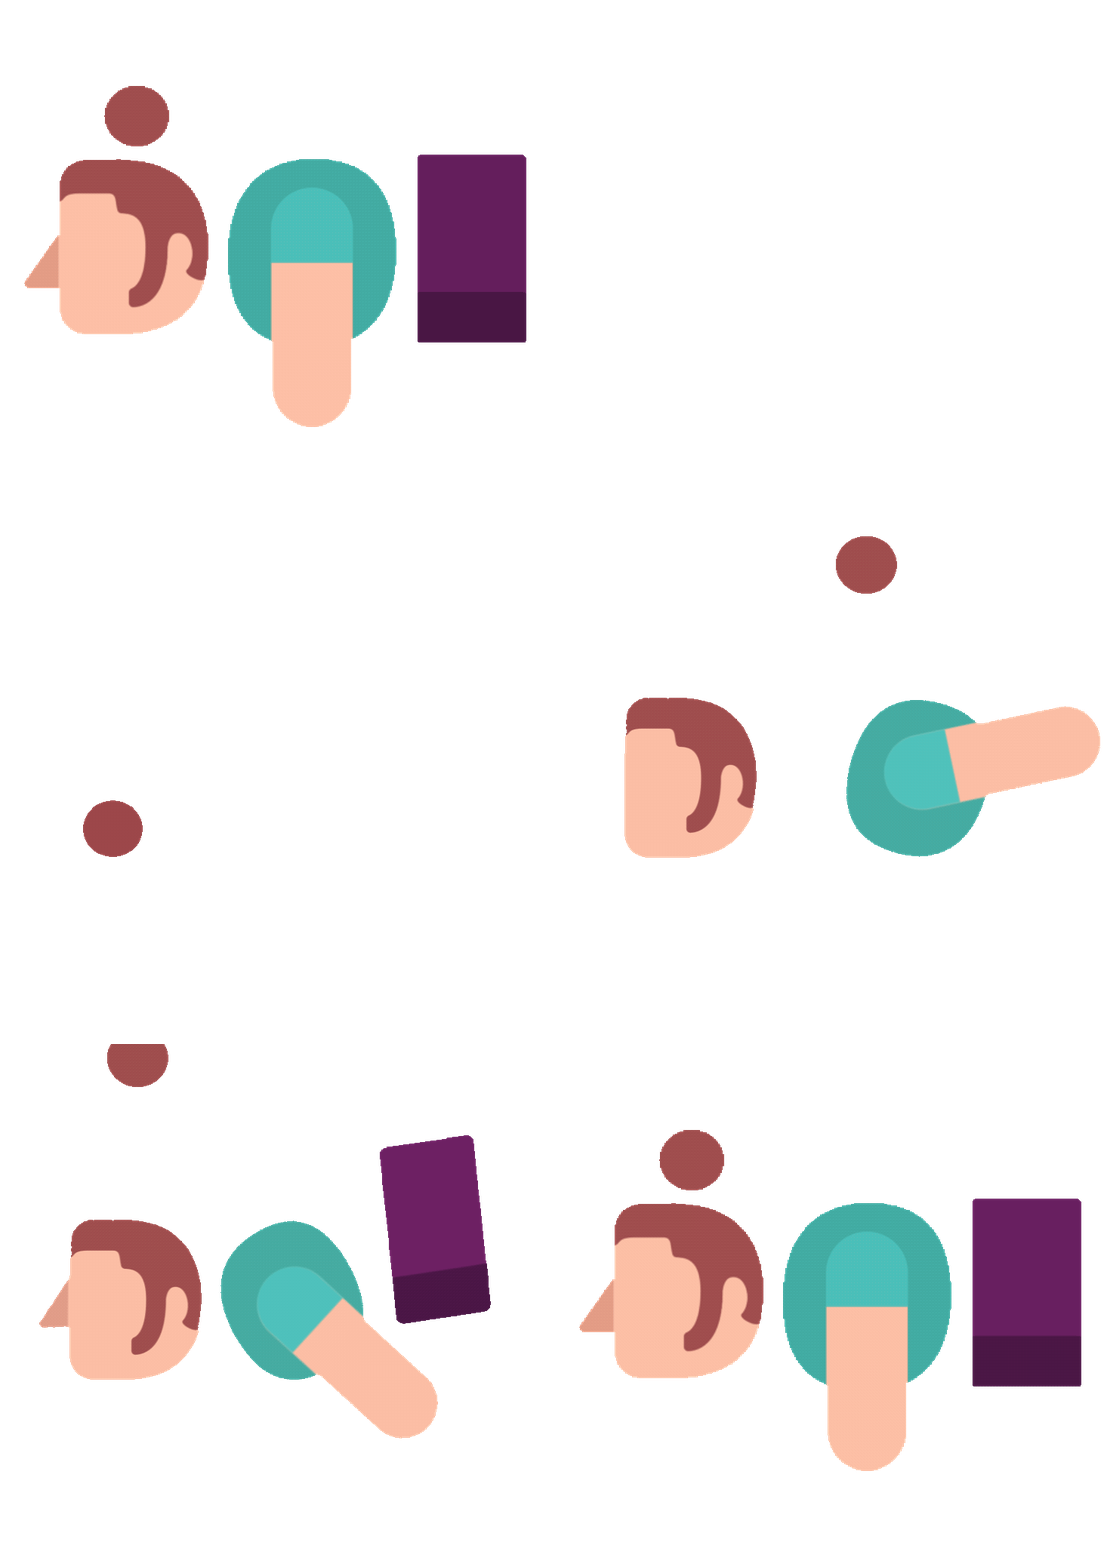
Goal at week two was to create a step-by-step or modular distribution of data that builds on top of each other and Find a story that can be enhanced by sequential visualization. Three questions were chosen due to the tone of question. One evoked sadness, one was more playful, and one was heartwarming. These short animations coupled with the selected questions created a emotional rollercoaster for the viewer.
Behind the scene of the stop-motion set.
Video before post production in After Effects.
INTERACTIVE EXPLORATION
The third weeks goal was to devise an open-ended approach that asks the audience to manipulate, contribute, or even shape the narrative through designed interventions. It was to find the story that can be enhanced by interaction visualization. The idea of this project was built on the concept that everyone has their unique answers to the same four questions. Designing and 3D-printing a spirograph allowed viewers to visualize how their answers differ or relate to one another.


